
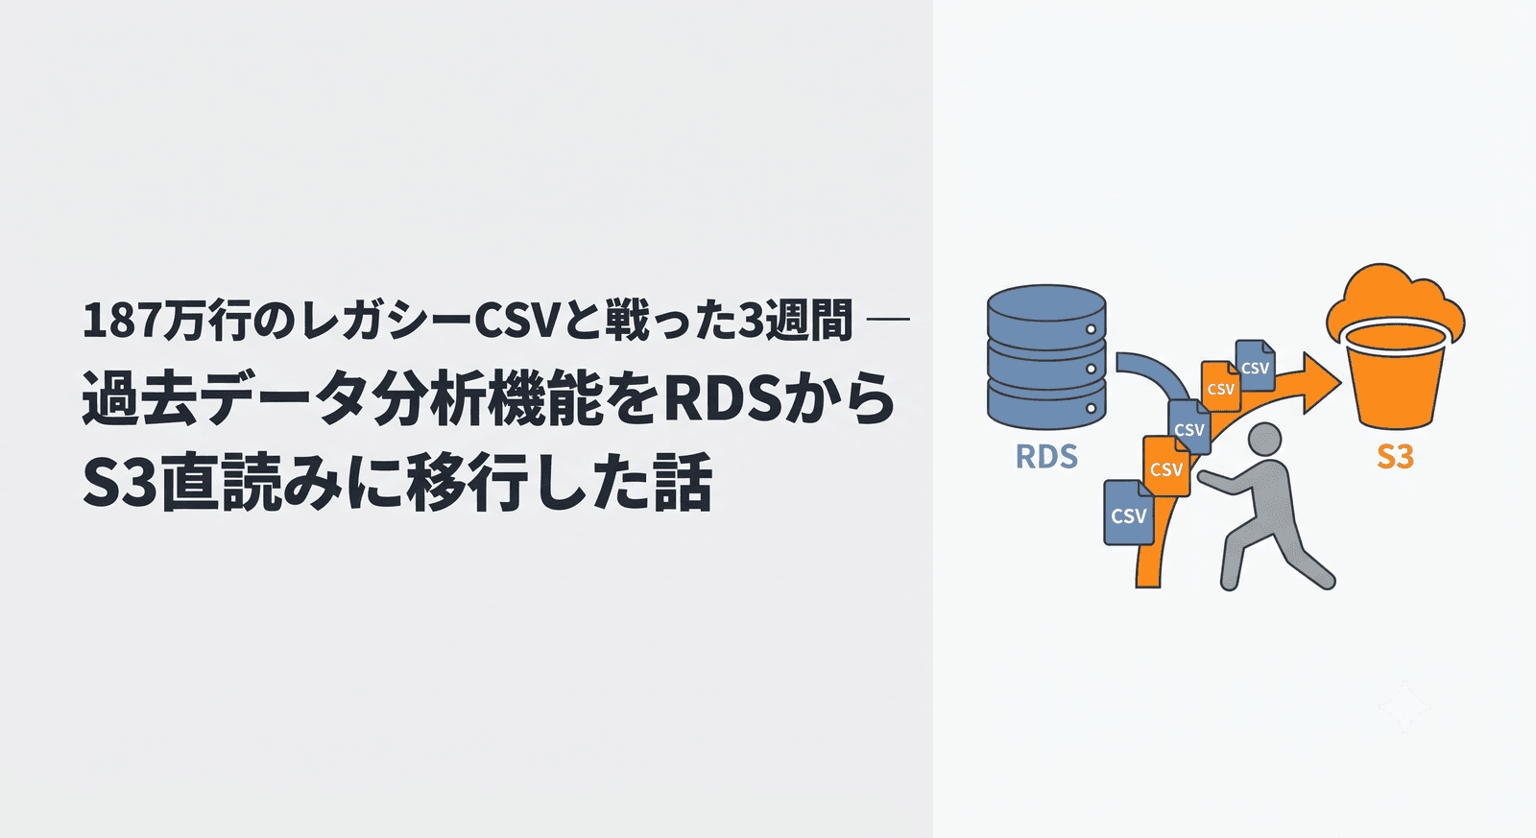
Three Weeks Fighting a 1.87-Million-Row Legacy CSV — Migrating Historical Data Analytics from RDS to Reading Straight from S3
目次
Hello! I'm @Ryo54388667!☺️
I work as an engineer in Tokyo! I mostly write TypeScript and Next.js, but lately I've been deep in Go and AWS backend work.
Today I'll share how we moved an internal system's historical data analytics off its RDS staging table, to an architecture that reads CSVs directly from S3!
The migration itself succeeded, but along the way we hit two out-of-memory process kills (OOM Kills) and one incident where the detail API couldn't return a single response (504 timeouts)..
If you're considering an S3-direct-read architecture, or running Go in containers and wrestling with memory, I think this article will be useful!
Background: A 159-Column, 1.87-Million-Row CSV with Serious Quirks
#Our internal TMS (transportation management system) has a "historical dispatch data analytics" feature that lets users search and aggregate the monthly CSV exports from the old dispatch system.
And this CSV is quite a specimen..
- Fixed 159 columns, Shift-JIS (CP932), CRLF. NUL bytes and in-field line breaks are mixed in, so naive CSV parsing breaks
- Each row is a multi-dimensional cross of "order number × detail line × data category," so (order number, line) is not unique
- The dispatch-record category repeats the full amount once per assigned carrier, so naively summing it overstates revenue (the interpretation of the categories itself is still provisional, pending final confirmation from the business side)
- Of the 159 columns, only about 40-50 actually mean anything
Inspecting a single month's file: of 15,092 physical rows, 14,505 were normal. 533 were continuation rows split by in-field line breaks, and 54 had too many columns. Only after a preprocessing step that stitches physical rows back into 159 columns do we get 15,091 logical rows.
For scale: each monthly file is 17-18MB raw with roughly 15,000 rows. The whole archive is 110 files from 2017-05 to 2026-06 — about 1.87 million rows, 2.1GB raw.
The First Design (RDS Ingestion) and What Happened
#"Come on, just load it into a relational database like a normal person," right? That's exactly what I did at first.
The initial design was the textbook one: an importer parses the CSV into an Aurora staging table (159 columns + JSONB), and dynamic SQL handles search. We released with a single month's data in production.
Within a month, problems traced back to the ingestion pipeline started piling up.
- The legacy CSV carries subcontracted-carrier info in two column families, but the importer only read the first one. For 212 orders (2.6%), the carrier's company name didn't appear on screen — and for 195 of those, several million yen worth of charter fees had no visible payee
- The list and count SQL used asymmetric GROUP BY granularity: 904 orders (11.2%) displayed as duplicates in production, and the pager stopped at page 82 when the data actually spanned 93 pages, leaving about 1,100 trailing rows unreachable
In both cases, the root problem was the same: the "transform data at ingestion time" step itself was a breeding ground for bugs.
And here's the thing — this data is append-only, updated exactly never. Aurora's transactional guarantees and write performance buy us nothing.
On top of that, there's data growth and cost. The data keeps swelling by about 15,000 rows every month. Loading all 110 months (1.87 million rows) would push up Aurora's storage and instance size, and the bill for keeping ever-growing data in an RDB was a real concern.
So I wrote an RFC (an architecture-migration proposal).
The Design Decision: Make the CSV Itself the Source of Truth
#The policy: "this is fundamentally a collection of monthly snapshots that must not be tampered with — so make S3 + Object Lock (an S3 feature that prevents deleting or overwriting stored files) the source of truth."
- The source of truth is gzip CSVs on S3, under the key convention
v1/legacy-dispatch/year=YYYY/month=MM/{start}_{end}.csv.gz - RDS holds no row data — only a file ledger
- Uploads are manual S3 PUTs by an administrator. A validation Lambda fires on the S3 event and checks the key convention, gzip integrity, the 159-column header, and a decompressed-size cap (512MiB, as a gzip-bomb guard). Invalid files are quarantined and reported via SNS
- Replacement works by putting a new file and logically invalidating the old one (supersede). Nothing is physically deleted
- A weekly consistency-check Lambda detects and self-heals drift between S3 and the ledger
- The API is a new
/api/v2/legacy-dispatches, run in parallel with the existing v1 (SQL path). v1 gets retired only after JSON-level parity verification passes
Three things decided it.
- Cost: the RFC's estimate put the RDS approach at roughly $300-500/month versus roughly $100-300/month for S3 direct reads. Not an order-of-magnitude change — the RFC itself states that a 20-50% reduction is the realistic outcome
- Correctness: making the CSV itself the source of truth structurally eliminates the entire class of data-loss bugs caused by ingestion-time transforms. A bug in read logic can be fixed after the fact; data dropped at ingestion time is gone
- Tamper resistance: Object Lock + a KMS CMK + MFA-required role separation
Meanwhile, the ADR contained this line: "the v2 API reads all files from S3 and expands them in memory. Handling data growth is future work."
That one sentence would come back to bite us.
Building It: Parity Tests and Real Infrastructure
#How Do You Guarantee "Parity" Between SQL and an In-Memory Engine?
#The technical heart of v2 is reproducing, in memory and 1:1, everything the dynamic SQL used to do: WHERE/HAVING, aggregation, sorting, pagination.
For correctness we went all-in on "parity tests" — feed v1 and v2 the same input and verify the responses match. The same 159-column Shift-JIS CSV flows through two paths:
- (A) importer → RDS → v1 API
- (B) gzip → MinIO (S3 stand-in for tests) → ledger registration → v2 API
and the responses are compared for exact JSON equality.
A matrix of 9 sort columns × 2 directions, pagination, and 19 filter types gave us 52 subtests in the first version (now 67, tracking later features). Every point that had bitten us before got its own pinpoint subtest.
Differences that tripped us up more than expected:
- Collation: v2 compares bytes in Go, while Postgres uses
en_US.utf8. Sorting and representative-row selection for non-numeric strings can theoretically diverge (as I'll touch on later, this was "kept from surfacing," not "solved") - Dates: lib/pq and
time.Parsedisagree on Location, so struct comparison failed. Solved by comparing JSON after formatting to "YYYY-MM-DD" - NUMERIC(10,2): normalized with
big.Rat.FloatString(2)to match the scale RDS round-trips add
The other key decision: the reader reuses the importer's pure functions (parsing, row stitching, row classification) as-is. With no duplicated parsing spec, the "v1 and v2 interpret a row differently" class of bugs is gone by construction.
Small Traps in the Real Infrastructure
#Implementing the validation Lambda and the Terraform (Object Lock bucket, KMS, DLQ, EventBridge, MFA roles) and enabling staging → prod, we stepped on more small traps.
- AWS Chatbot silently drops SNS messages that don't match its supported schema. Quarantine notifications published successfully but never reached Slack; we had to switch to the custom notification schema
- Detecting S3 404s with
errors.Asagainst*types.NoSuchKeydoesn't match for CopyObject/HeadObject. You need to check smithy's ErrorCode ("NoSuchKey"/"NotFound") - The path environment variables actually take to production is not Terraform but the ECS task definition JSON used by CI. The Terraform-side task definition is bootstrap-only with
ignore_changes, so adding a variable only in Terraform never reaches production
That third lesson pays off again later, with GOMEMLIMIT.
Historical backfill was designed to run through GitHub Actions. We turned csvcheck (validating calendar-date file names, gzip integrity, headers, and row counts) into a proper tool, dry-ran all 110 files locally until everything was green, and loaded 110 files (about 1.87 million rows) into prod on 2026-07-09.
Up to this point, everything was going smoothly.
The First Out-of-Memory Crash (OOM): ~10GB per Request
#After the backfill, hitting the v2 list API killed the task with an out-of-memory crash in about 28 seconds, returning a 502.
Here's what the investigation found.
- The v2 reader was still the PoC implementation: no cache, fully loading all 110 active files from S3 on every request
- The main culprit was raw-JSON generation: for every CSV row, it built a JSON blob re-embedding all 159 column headers, and kept every row's blob. The only place that raw JSON is actually used is one representative row on the detail screen..
- Back-of-the-envelope: ~7.9GB of raw JSON + ~1.7GB of typed structs — about 10GB per request. The ECS task's memory limit is 2048MiB
Not a fight we were going to win 😇
Fortunately, the frontend still pointed every screen at v1 (RDS), so users saw no functional impact. Not completely unscathed, though: the moment v2 blew up, v1 requests on the same task got dragged down into temporary 502s (1-2 minutes while tasks were replaced).
For containment, we flipped the ledger's validation status to "suspended," which emptied v2's serving set. The S3 objects stayed untouched — immediate effect, zero code changes.
Why didn't staging catch this? Because staging verification used a single 18MB file (75,000 rows). At that size, even full loading fits comfortably.
Functional testing with small data cannot detect out-of-memory failures. Making load tests with production-scale data a release gate — that was the most expensive lesson of the day.
Bonus: The Data Itself Had a Bomb in It
#During this investigation we also discovered that the 2026-06 file was a byte-for-byte duplicate (matching MD5) of the 2025-06 file.
The two files' mtimes were 15 minutes apart on the same day, so the likely story is a mix-up when the archive was pulled. In other words, the real June 2026 data never existed..
csvcheck only validated each file's own content and never cross-checked hashes between files, so this sailed right through. We later added csvcheck -dedup (detecting duplicates via sha256 of the compressed bytes). Cross-checking all 110 files takes 48 seconds (measured from work logs).
The Permanent Fix: "Don't Build, Don't Keep, Don't Read"
#The fix had three pillars plus one.
- A. Lazy raw-JSON generation: never generated for lists; even for details, only for rows matching the target order. This alone removes the biggest amplifier (~7.9GB)
- B. Per-file cache + singleflight: parse results are cached per file (an LRU that evicts the oldest when full), and concurrent loads of the same file are collapsed into one (singleflight)
- C. Date-range pushdown: the ledger gets a date-range query (±1 month margin) so period-scoped searches only read the relevant files. The default "last 13 months" is injected only at the handler layer
- D.
csvcheck -dedup(see above)
For C, instead of trusting gut feeling on "is a ±1 month margin enough?", we verified all 1.87 million production rows and confirmed there are zero cases of the same order number spanning adjacent monthly files before adopting it.
Fun fact: that full-scan verification did flag 10,605 "12-month-apart spans," which gave me a brief scare — but every one of them was the duplicated file pair above. The cloned June 2025 orders were just being counted as 12-month "spans."
We also added a wide-range guard: any search whose selected files total more than 500,000 rows is rejected with a 400 (RANGE_TOO_WIDE). It explicitly cuts off the remaining out-of-memory path where an all-period query loads ~1.7GB of structs in one request.
Parity tests and race tests: all green. That should have been the end of it.
The Second Out-of-Memory Crash (OOM): A Double Go Trap 🔍
#Following the earlier lesson, we loaded 109 real files — 1,730,545 rows — into staging and ran a production-scale load test.
Result: the very first v2 request (33 seconds in) died of memory exhaustion again (exitCode=137, the signature of an OOM Kill).
After the permanent fix. Seriously..
Three pieces of evidence pinned down the cause: the CloudWatch timeline, local measurements, and a memory probe (a temporary _test.go dropped into the service package, measuring against the 24 most recent real files — 429,719 rows).
The Cause Was Three Layers Deep
#- The all-file aggregation was filling the cache as it went. The representative-company map shown in lists requires folding over every active file (hereafter "fold"). Because the fold wrote into the per-file cache (capped at 24 files) as it scanned, the last stretch kept the 24 most recent files — about 490,000 rows — pinned in memory
- The real number was 1,820B per row — almost double the design estimate of 900B. Go's
encoding/csvbacks all 159 fields of a record with a single string, and each field is a substring of it. Even if you only want to keep ~20 columns, the entire 159-column row text can't be garbage-collected while any reference lives (substring pinning) - GOMEMLIMIT (the environment variable that gives the Go runtime a soft memory ceiling) wasn't set. With Go's defaults (GOGC=100), the heap grows to about twice the live data before GC runs — so at 900MB live, actual memory lands right at 2048MiB
Here's the story in code:
// encoding/csv backs all 159 fields of a record with one string.
// Each field is a substring of it, so even if you keep just a few
// fields, the whole row's text can't be GC'd while a reference lives.
record, _ := reader.Read()
keep := record[3] // this reference pins the entire row text

// If it goes into a long-lived cache, detach it first
keep = strings.Clone(record[3])
The probe's measurements doubled as the effect estimate for each fix (24 files, 429,719 rows).
| Scenario | Resident | Peak |
|---|---|---|
| A: implementation at the time (kept in LRU) | 746MB (1,820B/row) | HeapSys 1,391MB |
| B: fold without caching | 3MB | HeapAlloc 205MB |
C: store with strings.Clone | 402MB (981B/row, -46%) | — |
The Fixes
#- Make the fold read-only against the cache (get-only): it uses cached entries when present, but on a miss it streams, discards, and releases memory right after aggregating
- Change the cache limit from "file count" to "row count": a 24-file cap can mean 50,000 rows or 500,000 rows depending on file sizes. Budgeting by rows (up to 250,000 total) makes resident memory predictable: 981B/row × 250,000 rows ≒ 245MB. The default 13-month window (~226,000 rows) fits entirely
- Right before every cache put, swap every string field to a fresh allocation with
strings.Clone, severing it from the CSV row buffer. A reflect-based test automatically catches any newly added field missing its Clone - GOMEMLIMIT=1536MiB: set to 75% of the task's 2048MiB limit so GC gets aggressive before the ceiling. Per the earlier lesson, set symmetrically in both the task definition JSON and Terraform
Staging confirmed the fix: no more out-of-memory. Fold + list peaks at about 1.1GB, inside GOMEMLIMIT; once the cache is warm, lists take 0.8-1.8s for the default 13-month window and 62ms-0.6s for a single month.
As a control, tasks still on the old configuration were OOM-killed twice that same day. The gap between the guessed 900B and the measured 1,820B — that was the whole story of the recurrence.
Cold Start: 73 Seconds vs CloudFront's 30
#With memory fixed, the next bottleneck surfaced: from a cold, empty cache, the fold takes a measured 73-82 seconds (Fargate 1vCPU pegged at 92% CPU; my local M-series machine does it in 33 seconds, so about 2.5x slower).
The problem: CloudFront's limit on waiting for an origin response (OriginReadTimeout) is 30 seconds. Right after a deploy, the first request gets cut off at 30 seconds and has to hope one of up to 3 retries succeeds — hello, 5xx. Worse, follow-up requests that had piggybacked on the fold get collateral 500s when the lead request is cut.
The fix is a startup WarmUp: on boot, a background goroutine dry-fires the actual list path (the fold plus the default 13-month window's cache build). Staging shows about 6.5 minutes between ECS start and CodeDeploy's traffic shift, so the 73-second fold reliably finishes before traffic arrives. If it fails, it just logs a warning and falls back to lazy initialization — a safe-side design.
Two operational traps from the verification phase (both measured from work logs):
- During a CodeDeploy canary release (send 10% to the new version and watch for 5 minutes), 90% of requests go to the old tasks. Verifying right after deploying, I triggered the old code's memory crash and nearly misdiagnosed it as "it still reproduces on the new version!" Verify after the deployment completes
- Total warm-up takes a measured 152 seconds, but the canary's 10% starts flowing 94 seconds after boot. That leaves a 58-second window of traffic before warm-up finishes — gating traffic until warm-up completes (readiness gating) is future work
One more thing made this investigation harder: Container Insights had been down since 2026-07-07, so per-task metrics were unavailable. Losing observability in the middle of a memory investigation hurt..
The Detail API Meltdown and a Reverse-Lookup Index
#With lists stable, the next discovery: the detail-screen API was timing out (504) on every single request.
The detail path can't reuse the list cache (it holds no raw JSON), so it streamed through all 109 files in ascending order. Measured: about 1.0-1.1 files/second, roughly 110 seconds to finish. Design review had estimated "11-38 seconds per request" — reality was 3-10x that.
Worse, there was no singleflight and no context.WithoutCancel, so every time CloudFront cut the connection at 30 seconds and retried, the scan restarted from zero. One click occupied 90-98% CPU for about 3 minutes.
A small nugget from the investigation: if connections die at ~30 seconds, it's CloudFront (30s), not the ALB (60s). And the s3_key in the error log points at the scan's position, not the order's location — which lets you back-calculate scan speed.
Short-Term Fix: Reverse Lookup via the List Cache + singleflight
#- Inside the search window (last 13 months), reverse-look-up the list cache to identify the containing file, then re-fetch just that file in detail mode. In-window details dropped to 0.6-1.1 seconds (work-log measurements)
- Added per-order-number singleflight plus
context.WithoutCancel, so CloudFront's retries piggyback on the scan already in progress
This produced a delightful side effect: a 404 for a nonexistent order number came back "correctly" — after 86.9 seconds.
The full scan (~87s) squeaked into CloudFront's third-retry window (60-90s), and the retry riding the singleflight got the 404 delivered. Working as designed, technically — but the moment data growth pushes past 90 seconds, it's a 504 again. Correctness on a tightrope.
Permanent Fix: order_no_min/max in the Ledger
#To kill the full scan structurally, the ledger now stores each file's normalized order-number range (order_no_min/order_no_max), computed by the validation Lambda at registration time. Detail lookups read only candidate files whose range matches. And for candidates already in the list cache, we check the order's existence in memory first and skip the S3 GET entirely.
Design points I cared about:
- Three-value semantics: NULL means not-yet-computed, so always treat as candidate (fail-safe); empty string means computed-with-zero-normal-rows, so never a candidate; a value means range-check. We nearly stepped on the trap where
sql.NullStringcollapses empty strings into NULL — which would turn zero-normal-row files into an infinite loop for the weekly backfill — and specified it explicitly instead - A single source of truth for row selection: if "rows considered for range computation" and "rows the reader reads" drift apart, lookups silently miss. The row-classification function is shared across the importer, the reader, and the range computation, with a differential test pinning the superset relation
- Comparison collation: normalized keys are zero-padded to 10 characters, so Go's byte comparison matches Postgres's C collation — no dependency on Aurora's
en_US.utf8 - Deployment order: migration → Lambda → backfill → API. Break the order and "all files NULL = all files candidates" regresses you to the full scan
The measured change in staging (work-log measurements):
| Case | Before | After |
|---|---|---|
| Detail inside the window (last 13 months) | 0.6-1.1s | 3.5s ※ |
| Detail outside the window (e.g., 2018-06) | ~87-110s → 504 | 6.0-6.2s → 200 |
| Nonexistent order number | ~87s (the miracle 404) | 0.42-0.44s → 404 |
※ In-window details got slower as a trade-off of unifying on "details always fetch from S3" (adopted with the trade-off documented in the issue).
We closed that gap in follow-up work: a per-order-number cache for detail results plus fetching candidate files 4-way in parallel brought repeat visits from 4,667ms to 238ms (19.6x). We've also implemented materialization — pre-generating response JSON into the DB (design target: ~230ms end to end; production deployment and observation still pending as of this writing).
The Frontend Switch and Before/After
#With the backend stable, we switched the frontend from v1 to v2 across three PRs.
- Added offices and CSV export to v2, and turned RANGE_TOO_WIDE into a proper error code. Even here we hit one more bug: only the light DB query at the tail end of CSV export received the original cancellable ctx, so a heavy scan could finish completely and then die with a context-canceled 500 at the last step
- Switched the frontend API client to v2, made the loading-date From filter required, and gave the 500,000-row guard its own banner
- Raised the CSV export cap from 10,000 to 30,000 rows: one month is a measured 10,605 rows, so monthly users hit the cap every time (30,000 rows × 12 columns × 200B is about 6MB — a reasonable size). Fun aside: the original 10,000 cap had no recorded rationale anywhere, so before raising it I had to do archaeology on "why 10,000 in the first place?"
From the 7/9 memory crash to the 7/17 switch, user-facing functional impact stayed at essentially zero (the one exception: those 1-2 minutes of v1 collateral 502s).
Run v1 untouched in parallel, guarantee equivalence with parity tests, and switch only after v2 stabilizes. That unglamorous migration strategy is what contained two memory crashes and a total detail-API meltdown to "trial and error in a place users could barely see."
Here's the final Before/After.
| Metric | Before (RDS / v2 initial) | After (as of 2026-07) |
|---|---|---|
| Source of truth | Aurora staging table (159 columns + JSONB) | S3 gzip CSV + Object Lock |
| Ingestion-caused data loss | e.g., 212 orders with missing carrier names | Structurally eliminated — no transform step |
| List API | v2 initial: ~10GB per request → OOM 502 | 0.8-1.8s warm (13-month window) |
| Detail API | Full scan, every request 504 | ~6s out-of-window, 404 in 0.42s, repeat visits 238ms |
| Resident memory | ~900MB live during fold → OOM | Budgeted ceiling ~245MB, measured peak ~1.1GB |
| Cold start | First request triggers 73-82s fold → 5xx | Startup WarmUp finishes before traffic |
| Infra cost (estimate) | roughly $300-500/month on RDS | roughly $100-300/month on S3 direct reads |
| Correctness guarantee | — | 67 v1↔v2 parity subtests |
Lessons Learned
#- Functional tests with small data cannot detect out-of-memory failures. Make production-scale load testing a release gate — and not "once and done": it's needed for every change that touches memory
- Measure bytes-per-row; never estimate it. In Go,
encoding/csv's substring pinning made reality double the estimate computed from "columns we keep." Strings held long-term in a cache get severed withstrings.Clone - If you run Go in containers, GOMEMLIMIT is mandatory. With defaults, actual memory grows to about twice the live data. And check that your environment variables travel the path that actually reaches production
- Cap caches by content volume (rows/bytes), not entry count. An entry-count cap gets betrayed by size variance every time
- Your CDN's timeout is your de facto SLA ceiling. Anything beyond CloudFront's 30 seconds amplifies load through retries and still ends in 5xx. Use singleflight plus
context.WithoutCancelso retries ride the work already in progress - Never ship a full scan, even one that's "fast for now." Even the design-review estimate exceeded CloudFront's limit — and reality was 3-10x worse. Keeping reverse-lookup metadata in the ledger is cheaper in the end
- Cross-check file hashes before loading. Per-file validation alone will never catch "an exact duplicate loaded as a different month"
- Migrate via parallel operation plus parity tests. Sharing the parse functions and pinning exact JSON equality in CI was the best cost-benefit we found
- During a canary, 90% of your verification traffic hits the old tasks. Distrust any "it reproduces!" observed right after deploying
- Leave a rationale next to every magic number. Nobody recorded why the cap was 10,000, so raising it required archaeology first. The new 30,000 has its reasoning written down
- Maintain observability in peacetime. With Container Insights down, we fought a memory investigation with no per-task metrics — a double bind
Wrapping Up
#This article covered three weeks of migrating 1.87 million rows of legacy CSV from an RDS staging table to reading directly from S3.
There's still homework left.
- Re-obtain and re-upload the correct June 2026 data
- Delete the v1 endpoints and the staging table, then downsize Aurora (only then is the cost benefit actually harvested)
- Deploy detail-response materialization to production and observe
- The 58-second window where canary traffic arrives before WarmUp finishes (readiness gating)
- Final business-side confirmation of the data-category interpretation
If you're fighting an S3-direct-read architecture or a giant legacy CSV of your own, I hope this helps!
If you know a better way, please let me know~
Thank you for reading to the end!
I tweet casually, so feel free to follow me! 🥺
If this article helped you, I'd be moved to tears if you'd send a tip (an Amazon gift card) from my wish list 🥺
